


6 Powerful Javascript Charting Features Available To Svelte Dashboards

Froala Charts is a JavaScript charting library that lets you create interactive charts, gauges, maps, and dashboards using JavaScript. We have built a simple and lightweight Svelte directive, which provides bindings for svelte-froalacharts and lets you add JavaScript charts in your Svelte application or project without any hassle.
Static charts are nice but interactive charts can take a dashboard to the next level. Froala Charts offers events and an API, drill down deep into data, tooltips for context, loading screens; zoom scroll and pan to get in close with your data, and number formatting with on-the-fly conversion.
You can use Javascript libraries to create charts and implement them in your applications using Froala’s Javascript Editor.
How can I use a Javascript chart Events/API?
Customize how charts behave when users perform certain actions, using events and APIs.
Take a deep dive into the events system of Froala Charts.
Can Javascript Charts have Drill Downs?
Drill down to endless levels to provide viewers with deep insights into data.
- beforeDrillDown
- drillDown
- beforeDrillUp
- drillUp
- drillDownCancelled
- drillUpCancelled
Explore the drill down events available to Svelte.
How do I implement Javascript Chart Tooltips?
Make beautiful and informative tooltips to help viewers quickly see context-sensitive information about data.
chartMouseMove is triggered when the mouse pointer is moved over a chart. The event arguments pass useful information related to pointer location, relative to the chart and the page, that can be used for positioning elements like annotations or integrating charts with custom tooltip libraries.
By default, a chart does not trigger this event until it is enabled to do so. To enable this event for a chart, set the enableChartMouseMoveEvent attribute to 1.
Can I load a Javascript Chart Loading Config?
Display messages or images, every time the chart loads. Customize the message/ source image in any way you want, and link it to the chart.
Find out more about chart configuration initialization in a Svelte app.
Do Javascript Froala Charts support Zoom/Scroll/Pan?
Zoom, scroll, and pan through Zoom Scatter charts, for better insights into individual data plots, or compare between two series of data values.
Configure zooming through setZoomMode.
Can I do Number Formatting in Javascript?
Display numbers in global/European formats, and let viewers switch between them on the fly.
Formats input numbers based on the formatting configuration passed. The function can be called globally on the Froala Chartsobject or on a specific instance of Froala Charts.
When called globally on the FroalaCharts object, the function applies the configuration settings to all numbers on the chart.
Explore the formatNumbers method for Froala Charts.
Froala Charts is easy to install with npm.
npm install svelte-froalacharts froalacharts --save
After installing the FroalaCharts components, you can replace the code in App.svelte file with the code shown in the steps below to create your first chart. Import all the required dependencies in the <script> tag to get started.
<script>
//Step 1 : import dependecies
import FroalaCharts from "froalacharts";
import FroalaTheme from "froalacharts/themes/froalacharts.theme.froala";
import SvelteFC, { fcRoot } from "svelte-froalacharts";
// Always set FroalaCharts as the first parameter
fcRoot(FroalaCharts, FroalaTheme);

//Step 2: preparing the chart Data
const chartData = [
{
  data: [
  {
    value: "10000",
  },
  {
    value: "11500",
  },
  {
    value: "12500",
  },
  {
    value: "15000",
  }]
}];

//Step 3 : Create your configuration object
const chartConfig = {
  type: "column",
  renderAt: "ft",
  width: "800",
  height: "500",
  dataSource:
  {
    chart:
    {
      theme: "froala",
      caption: "Comparison of Quarterly Revenue",
      xAxisname: "Quarter",
      yAxisName: "Revenues (In USD)",
      numberPrefix: "$",
    },
    categories: [
    {
      category: [
      {
        label: "Q1",
      },
      {
        label: "Q2",
      },
      {
        label: "Q3",
      },
      {
        label: "Q4",
      }]
    }],
    dataset: chartData
  }
};
</script>

<SvelteFC {...chartConfigs}/>
Finally export the app from main.js
import App from "./App.svelte";
  var app = new App({
    target: document.body
  });
  export default app;
And run it via:
npm run dev
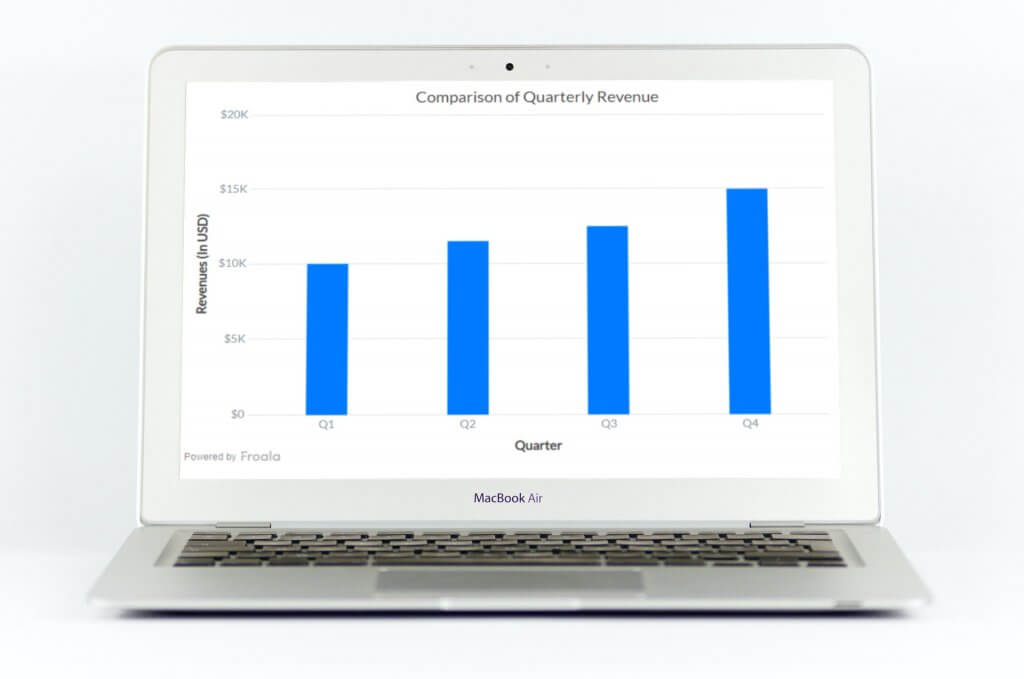
Here is what the final chart looks like:
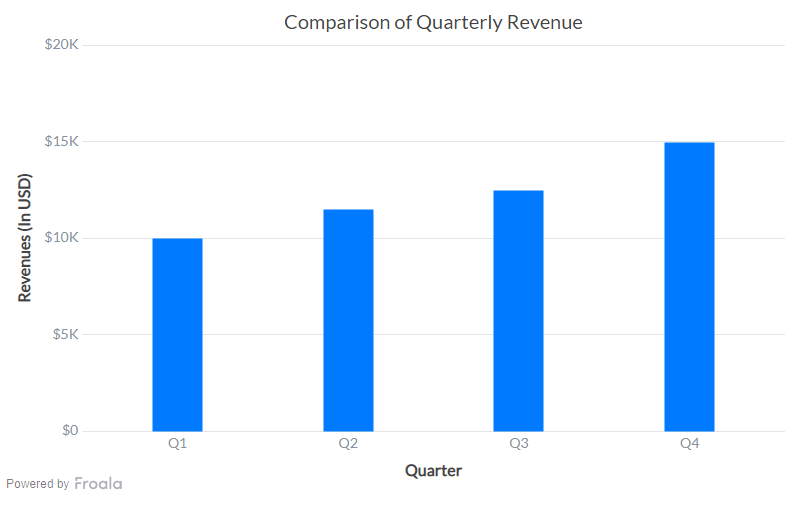
Now that you’ve seen how easy it is to start building charts with Svelte and Froala Charts you can build out a whole dashboard pretty quickly.
Head over and find the full tutorial for building visual stunning dashboards with Svelte.


No comment yet, add your voice below!