Days
Hours
Minutes
Seconds
x

Froala Editor v4.2.0 is Here LEARN MORE

Skip to content

Column Chart

Column charts represent data with rectangular horizontal bars. The height of the bars is proportional to the values they represent. The numeric values are plotted along the y-axis, and the data labels are plotted along the x-axis. Column charts are best fitted when you want to compare values.
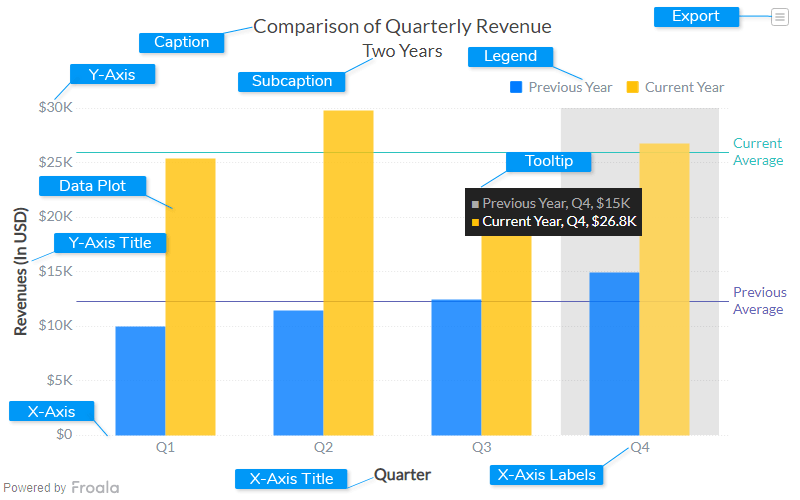
Caption

The caption (also called the chart title) is the heading of your chart. You can add custom text for the caption, as well as configure its font properties and cosmetics. Learn more about it

Subcaption

The sub-caption (also called the chart subtitle) is the sub-heading of your chart. You can add custom text for sub-caption, as well as configure its font properties.

Data Plot

Data plot refers to the pie slices in a pie chart, columns of the column chart, lines in a line chart.

Legend

A legend is a chart element used to display the series name for each dataset, in case of multi-series or combination charts. Legends are used to correlate a data plot to its series name using its color.

Tooltip

A tooltip is displayed when the mouse cursor hovers over a particular data point. It denotes valuable information about the data plot hovered.

X-Axis

X-Axis refers to a line on a chart that runs horizontally (left-right).

Y-Axis

Y-Axis refers to line or values on a chart that runs vertically (up-down) through zero.

X-Axis Labels

X-Axis labels are the names of the data points that are displayed on the x-axis of a chart.

X-Axis Title

Refers to title of the x-axis

Y-Axis Title

The title of the y-axis

Create a Column chart

Let's create column chart showcasing the comparison between quarterly revenue earned for the previous year and the current year. The columns for both datasets, one for the previous year and one for the current year, have been rendered using different colors. This makes it easy to interpret and compare the data.

To create a column chart follow the steps given below:

  • In the JSON data, set the attributes and their corresponding values in "$ltattributeName$gt": "%ltvalue>" format.
  • Specify the chart type using the type attribute. To render a column chart, set column.
  • Set the container object using renderAt attribute.
  • Specify the dimension of the chart using width and height attributes.
  • Set the type of data (JSON) you want to pass to the chart object using dataFormat attribute.

For a detailed list of attributes, refer to the column chart attributes page.

[class^="wpforms-"]
[class^="wpforms-"]
[bws_google_captcha]
<div class="gglcptch gglcptch_v2"><div id="gglcptch_recaptcha_46074450" class="gglcptch_recaptcha"></div> <noscript> <div style="width: 302px;"> <div style="width: 302px; height: 422px; position: relative;"> <div style="width: 302px; height: 422px; position: absolute;"> <iframe src="https://www.google.com/recaptcha/api/fallback?k=6Ld6lNoUAAAAAM626LfCOrnkBFJtYZAKESFCjgv_" frameborder="0" scrolling="no" style="width: 302px; height:422px; border-style: none;"></iframe> </div> </div> <div style="border-style: none; bottom: 12px; left: 25px; margin: 0px; padding: 0px; right: 25px; background: #f9f9f9; border: 1px solid #c1c1c1; border-radius: 3px; height: 60px; width: 300px;"> <textarea id="g-recaptcha-response" name="g-recaptcha-response" class="g-recaptcha-response" style="width: 250px !important; height: 40px !important; border: 1px solid #c1c1c1 !important; margin: 10px 25px !important; padding: 0px !important; resize: none !important;"></textarea> </div> </div> </noscript></div>
[class^="wpforms-"]
[class^="wpforms-"]
[bws_google_captcha]
<div class="gglcptch gglcptch_v2"><div id="gglcptch_recaptcha_1672747069" class="gglcptch_recaptcha"></div> <noscript> <div style="width: 302px;"> <div style="width: 302px; height: 422px; position: relative;"> <div style="width: 302px; height: 422px; position: absolute;"> <iframe src="https://www.google.com/recaptcha/api/fallback?k=6Ld6lNoUAAAAAM626LfCOrnkBFJtYZAKESFCjgv_" frameborder="0" scrolling="no" style="width: 302px; height:422px; border-style: none;"></iframe> </div> </div> <div style="border-style: none; bottom: 12px; left: 25px; margin: 0px; padding: 0px; right: 25px; background: #f9f9f9; border: 1px solid #c1c1c1; border-radius: 3px; height: 60px; width: 300px;"> <textarea id="g-recaptcha-response" name="g-recaptcha-response" class="g-recaptcha-response" style="width: 250px !important; height: 40px !important; border: 1px solid #c1c1c1 !important; margin: 10px 25px !important; padding: 0px !important; resize: none !important;"></textarea> </div> </div> </noscript></div>
[class^="wpforms-"]
[class^="wpforms-"]
[bws_google_captcha]
<div class="gglcptch gglcptch_v2"><div id="gglcptch_recaptcha_115205527" class="gglcptch_recaptcha"></div> <noscript> <div style="width: 302px;"> <div style="width: 302px; height: 422px; position: relative;"> <div style="width: 302px; height: 422px; position: absolute;"> <iframe src="https://www.google.com/recaptcha/api/fallback?k=6Ld6lNoUAAAAAM626LfCOrnkBFJtYZAKESFCjgv_" frameborder="0" scrolling="no" style="width: 302px; height:422px; border-style: none;"></iframe> </div> </div> <div style="border-style: none; bottom: 12px; left: 25px; margin: 0px; padding: 0px; right: 25px; background: #f9f9f9; border: 1px solid #c1c1c1; border-radius: 3px; height: 60px; width: 300px;"> <textarea id="g-recaptcha-response" name="g-recaptcha-response" class="g-recaptcha-response" style="width: 250px !important; height: 40px !important; border: 1px solid #c1c1c1 !important; margin: 10px 25px !important; padding: 0px !important; resize: none !important;"></textarea> </div> </div> </noscript></div>